Research
Bioinformatics and downstream computational analysis
The Bioinformatics team located both in Munich and at NNF-CPR ( ![]() Centre for Proteomics Research in Copenhagen) uses cutting edge technology to research bioinformatic challenges in mass spectrometry-based proteomics. We cover a wide range of topics across the entire pipeline associated with MS-based proteomics from directly processing raw data to downstream data analysis in clinical applications. Technologically, we build upon Python as a modern dynamically typed language with a clear syntax ideal for working at the intersection of different disciplines while also having access to a rich ecosystem of fantastic packages that enable using the latest advances in machine and deep learning. For writing highly performant code both for GPU and CPU, Numba (
Centre for Proteomics Research in Copenhagen) uses cutting edge technology to research bioinformatic challenges in mass spectrometry-based proteomics. We cover a wide range of topics across the entire pipeline associated with MS-based proteomics from directly processing raw data to downstream data analysis in clinical applications. Technologically, we build upon Python as a modern dynamically typed language with a clear syntax ideal for working at the intersection of different disciplines while also having access to a rich ecosystem of fantastic packages that enable using the latest advances in machine and deep learning. For writing highly performant code both for GPU and CPU, Numba ( ![]() https://numba.pydata.org/) is one of our favorites as it can massively speed up computations (often 100x) and allows us to write performant code while focusing on our domain knowledge in MS-based proteomics. We found Jupyter Notebooks to be excellent for developing and sharing ideas. In particular, nbdev (
https://numba.pydata.org/) is one of our favorites as it can massively speed up computations (often 100x) and allows us to write performant code while focusing on our domain knowledge in MS-based proteomics. We found Jupyter Notebooks to be excellent for developing and sharing ideas. In particular, nbdev ( ![]() https://github.com/fastai/nbdev)
https://github.com/fastai/nbdev)


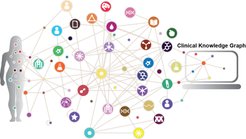
The clinical knowledge graph (CKG) enables users to analyze clinical proteomics data with the opportunity to integrate and mine knowledge from multiple biomedical databases. The two main objectives of the CKG are (1) to build a graph database including both experimental data and data imported from diverse biomedical databases and to (2) subsequently automate knowledge discovery, making use of all the information contained in the graph. The CKG is fueled by the powerful Neo4j graph database management system and Python. For more details on the CKG you can read our preprint ( Santos et al., Nat. Biotech., 2022) and check out the CKG documentation page ( https://ckg.readthedocs.io/en/latest/INTRO.html ).

AlphaPept provides a novel ultra-fast data analysis toolbox for MS/MS data analysis. This Python library is designed to engage both programmers and end-users by providing an intuitive graphical user interface as well as the opportunity to create highly customized and scalable workflows. The code is highly modular and performance-optimized by using just-in-time compilation (JIT) using Numba and efficient parallelization as well as GPU computing. We use AlphaPept to build the next generation of MS analysis workflows and rapidly test and implement new ideas as well as adapt groundbreaking algorithms. Importantly, AlphaPept builds on Python and its scientific stack but is also meant as a collaborative development environment with low barriers to entry for the community to contribute.

AlphaMap Visual inspection is an integral part in analysing and interpreting proteomics data. Our AlphaMap software enables the exploration of proteomic datasets on the peptide level. It is possible to evaluate the sequence coverage of any identified protein and its post-translational modifications (PTMs). AlphaMap further integrates all available UniProt sequence annotations as well as information about proteolytic cleavage sites. The functionality of AlphaMap can be accessed via an intuitive graphical user interface or—more flexibly—as a Python package that allows its integration into common analysis workflows for data visualization. AlphaMap produces publication-quality illustrations and can easily be customized to address a given research question. As part of the AlphaPept ecosystem, AlphaMap is freely available and fully open-source ( https://github.com/MannLabs/alphamap ).

AlphaTims
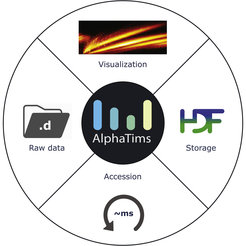
Our AlphaTims software allows researchers to investigate raw Bruker LC-TIMS-QTOF data (https://doi.org/10.1016/j.mcpro.2021.100149) with billions of datapoints. Due to the highly efficient indexing scheme, accessing arbitrary selections of these five-dimensional data becomes almost instantaneous. To ensure portability and not waste future resources we store the indexed data in industry standard HDF files (https://www.hdfgroup.org/). Owing to the excellent performance of the Holoviews ecosystem and in particular Datashader, visualization is just as fast and very intuitive (https://holoviews.org/, https://datashader.org/). Alphatims is freely available, fully open-source and can be used through a graphical user interface, command-line interface, or Python module on all major operating systems. It is part of the AlphaPept ecosystem and was built on the same principles: Python language, excellent documentation, ease-of-use, performance and low-threshold collaborative opportunities (https://github.com/MannLabs/alphatims).
Machine learning and deep learning in proteomics
We employ state-of-the-art machine learning and deep learning techniques for tasks in raw MS data analysis and spectrum predictions, as well as for the analysis of clinical proteomics data. The data richness of proteomic profiles is ideally suited for Machine Learning and we have already shown how it enables the classification of patients with various diseases based on different body fluids, such as the determination of Alzheimer's disease based on CSF ( Bader et al., Mol Syst Biol., 2020) or the classification of liver disease by plasma proteome profiling ( Niu et al., Nat. Medicine, 2022).
Data visualization
One important aspect in research, especially the ‘omics’ fields, is to provide tools to holistically inspect, exploit and validate the large datasets that are being generated. To this end, we develop visual exploration tools for inspecting raw proteomics data as well as algorithmic output and processed results. One powerful approach for rapid visualization of millions of data points is given with the Holoviz toolbox ( ![]() https://holoviz.org/), which can be used to create web applications readily. One example for a web application to explore data of a recently published study in which we investigated the role of ubiquitination in the circadian cycle can be inspected here:
https://holoviz.org/), which can be used to create web applications readily. One example for a web application to explore data of a recently published study in which we investigated the role of ubiquitination in the circadian cycle can be inspected here: ![]() http://cyclingubi.biochem.mpg.de/
http://cyclingubi.biochem.mpg.de/


