Motion Analysis - computerized cell tracking for the analysis of phototaxis and signal transduction of Halobacterium salinarum
I. Introduction
The whole photobiochemistry of Halobacterium salinarum is based on the function of its four retinal proteins bacteriorhodopsin (BR), halorhodopsin (HR) and the sensory rhodopsins SRI and SRII (Fig.1). BR uses light to produce ATP via a proton gradient, HR uses light to pump chloride ions into the cell and thus to maintain the osmotic balance of the cell during growth. SRI and SRII on the other hand are light sensors that enable the cell to search for areas with light conditions optimal for the function of BR and HR and to flee from harmful UV light and blue light which is inefficient for photosynthesis ( Hoff et al., 1997; Marwan and Oesterhelt, 1999).

II. The principle of the Motion Analysis system
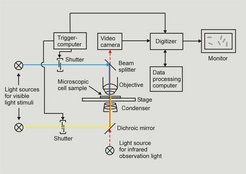
The Motion Analysis system (Fig. 2) is a computerized cell tracking system that allows the analysis of the swimming behaviour of unicellular organisms like H. salinarum. Parameters like swimming speed, percentage of reversing cells, response time (the time elapsing between application of a stimulus and reversal of the cells) can be measured in an automated way.

III. Insights in Phototaxis and Signal Transcduction obtained with Motion Analysis
The results of single and double flash experiments yielded an equation that describes the dependence of the response time tR (the time elapsing between the onset of a stimulus and motor switching) of H. salinarum cells on the various parameters of the flash program (Marwan and Oesterhelt, 1987).

At saturating light intensity, the response time adopts a minimal value of t(R) = t(min) ca 1 sec. Below the saturation level, it is reciprocally proportional to the light exposure of the total pulse [I * (τ1 + τ2)]. The third term of the equation describes the cellular response to double-pulse stimulation. The response time is proportional to the dark interval D, which separates the two pulses, and it is also proportional to the ratio of the duration of the second pulse τ2 and the total of both pulses τ.

These results led to the proposal of a mechanism in which activated photoreceptor molecules cause the catalytic formation of the switching signal (Marwan and Oesterhelt, 1987). Starting from this mechanism, only recently a kinetic model that reproduces the experimental findings to a satisfying grade was developed (Nutsch et al., 2003). When the light intensity of a blue light flash is decreased below a certain threshold another phenomenon can be observed. Sometimes a cell responds to a flash with a maximal average response time tmax of about 2.5 s, but sometimes the same cell does not respond at all. At these light intensities the probability of a cell to respond to a flash depends on the photon exposure (number of photons/m2) and can be described with the help of Poisson statistics. By measuring the frequency at which single cells respond to a flash at different light intensities and subsequent evaluation with Poisson statistics, it could be shown that in principle the absorption of a single photon by SRII is sufficient for a cell to reverse (Marwan et al., 1988). A similar approach was used to determine the concentrations of SRI and SRII during the growth of H. salinarum (Otomo et al., 1989) and supplied important evidence that SRI is not only a receptor for orange light but also for UV-light (Marwan and Oesterhelt, 1990).
As a summary it can be said that, depending on the range of photon exposure, light either influences the probability of a cell to respond to a stimulus (validity range of Poisson statistics) or the response time t(R) (validity range of the flash equation). These are ideal conditions for a systems biology approach in which the signal transduction network of H. salinarum is modeled. In an iterative process of experimenting and modeling we and our cooperation partners (Dr. W. Marwan; Dr. T. Nutsch; Prof. E.D. Gilles) attempt to refine and extend the existing model (Nutsch et al., 2003).
References
-
Hoff, W.D., Jung, K.H. and Spudich, J.L. (1997)
Molecular mechanism of photosignaling by archaeal sensory rhodopsins.
Annu Rev Biophys Biomol Struct, 26, 223-258.
-
Marwan, W., Hegemann, P. and Oesterhelt, D. (1988)
Single photon detection by an archaebacterium.
J Mol Biol, 199, 663-664.
-
Marwan, W. and Oesterhelt, D. (1987)
Signal formation in the halobacterial photophobic response mediated by a fourth retinal protein (P480).
J Mol Biol, 195, 333-342.
-
Marwan, W. and Oesterhelt, D. (1990)
Quantitation of photochromism of sensory rhodopsin-I by computerized tracking of Halobacterium halobium cells.
J Mol Biol, 215, 277-285.
-
Marwan, W. and Oesterhelt, D. (1999)
Biochemische Mechanismen einer einfachen Verhaltensreaktion.
Chemie in unserer Zeit, 33, 140-151.
-
Nutsch, T., Marwan, W., Oesterhelt, D. and Gilles, E.D. (2003)
Signal processing and flagellar motor switching during phototaxis of Halobacterium salinarum.
Genome Res, 13, 2406-2412.
- Oesterhelt, D., W. Marwan W.
Signal Transduction in Halobacterium halobium.
In: Biology of the Chemotactic Response (J.P. Armitage, J.M. Lackie. eds.)
Cambridge Univ. Press, 1990, pp. 219-239.
-
Otomo, J., Marwan, W., Oesterhelt, D., Desel, H. and Uhl, R. (1989)
Biosynthesis of the two halobacterial light sensors P480 and sensory rhodopsin and variation in gain of their signal transduction chains.
J Bacteriol, 171, 2155-2159.


